
Xin Ou
Research expert covering Greater China
When talking about e-commerce, it is almost natural for people to think of Amazon or eBay. Their reputation precedes them not only because they have forged the path of online retail sales for more than two decades, but for having maintained their leadership over time. As of 2025, however, there are several Chinese marketplaces, among others, that have disrupted the global market. Most notably, Temu and AliExpress have spread across the world at an unprecedented pace, topping global app download rankings and growing steeply in revenue. These companies all demonstrate how third-party online selling and dropshipping are gradually increasing their dominance in global e-commerce.
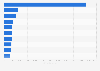
Contrary to online retailers and direct-to-consumer online stores, revenue is not the clearest indicator to measure an online marketplace’s performance. Due to the focus on third-party selling on a marketplace, gross merchandise value (GMV), i.e., the total value of goods sold, is best suited to indicate the level of activity occurring on a storefront such as Amazon or AliExpress. The global ranking of online marketplaces by GMV is topped by Amazon, with a gross merchandise value of nearly 800 billion U.S. dollars in 2024. Remarkably, Amazon is followed by five Chinese marketplaces that generate most of their GMV domestically. Pinduoduo, Douyin (the Chinese equivalent of TikTok), JD.com. and Alibaba-owned Taobao and Tmall all generated upwards of 500 billion U.S. dollars in 2024, far ahead of Western competitors such as Walmart and eBay.
In light of the growing reach of e-commerce, brick-and-mortar stores have also begun offering their e-retail platforms to third-party sellers. Walmart, for instance, launched its own online marketplace in 2009. After several years without much novelty, the bet started to pay off. Today, America’s largest retailer has become one of the world's leading e-retailers while maintaining its robust momentum for further growth.
Faced with an increasingly competitive landscape, some e-commerce companies have opted for a different business model. Instead of offering everything for everyone, Etsy focuses on filling the niche of handmade and vintage items. This online C2C/B2C retail platform has built much of its success by providing customers with a more personalized shopping experience than mass merchandise sales. The number of active buyers on Etsy more than doubled from 2019 to 2021, and remained at around 95 million in 2024.
A new player has inserted itself into the marketplace field. Temu, a direct competitor to Aliexpress and Shein, barged in with low prices and a wide range of products, gaining market share at a rapid pace. In 2024, just two years after its conception, Temu’s app was the most downloaded app worldwide. In 2025, Temu recorded over one billion monthly visits to its temu.com storefront - impressive numbers for a relatively new company. However, the brand’s popularity is not the only thing that has been rising. In recent years, Temu has been involved in several controversies, from the mishandling of personal client data to allegations of forced labor in the production process.
The online marketplace model works well everywhere. Large enterprises use their technological edge and distribution facilities to provide the most seamless online shopping experience available to both consumers and sellers. In this cross-border age where online marketplaces have truly gone global, Amazon is feeling the heat of its predominantly Chinese-based competitors, while consumer-to-consumer platforms like Etsy are threatening the market position of eBay.

Detailed statistics
Leading large cap e-commerce companies worldwide 2025, by market cap

Detailed statistics
Leading e-commerce websites worldwide 2025, by monthly visits

Detailed statistics
Most downloaded marketplace apps worldwide 2024

Global retail e-commerce revenue 2025, by region
Total retail e-commerce revenue worldwide in 2025, by region (in billion U.S. dollars)
Leading large cap e-commerce companies worldwide 2025, by market cap
Leading e-commerce companies worldwide as of November 2025, by market cap (in billion U.S. dollars)
Leading e-commerce websites worldwide 2025, by monthly visits
Most popular e-commerce websites worldwide as of August 2025, by monthly visits (in millions)

Top e-commerce marketplaces worldwide 2024, by gross merchandise value
Leading online marketplaces worldwide in 2024, by gross merchandise value (in billion U.S. dollars)
Most downloaded marketplace apps worldwide 2024
Leading marketplace apps worldwide in 2024, by number of downloads (in millions)

Distribution of major e-commerce retailers' GMV 2024, by sales type
Breakdown of leading e-commerce platforms' gross merchandise volume (GMV) in 2024, by sales type

Leading online marketplaces in the U.S. 2024, by GMV
Most popular online marketplaces in the United States in 2024, based on gross merchandise value (in million U.S. dollars)

Leading online marketplaces in China 2024, by GMV
Most popular online marketplaces in Greater China in 2024, based on gross merchandise value (in million U.S. dollars)

Leading online marketplaces in the UK 2024, by GMV
Most popular online marketplaces in the United Kingdom in 2024, based on gross merchandise value (in million U.S. dollars)

Leading online marketplaces in Germany 2024, by GMV
Most popular online marketplaces in Germany in 2024, based on gross merchandise value (in million U.S. dollars)
Leading online marketplaces in France 2024, by GMV
Most popular online marketplaces in France in 2024, based on gross merchandise value (in million U.S. dollars)

Popular online marketplaces Australia 2024, by gross merchandise value
Leading online marketplaces in Australia in 2024, by gross merchandise value (in million U.S. dollars)

Amazon quarterly net sales revenue 2007-2025
Net sales revenue of Amazon from 1st quarter 2007 to 4th quarter 2025 (in billion U.S. dollars)

Quarterly value of Amazon third-party seller services 2017-2025
Value of third-party seller services of Amazon worldwide from 4th quarter 2017 to 3rd quarter 2025 (in billion U.S. dollars)

Amazon marketplace gross merchandise volume 2025, by top domains
Gross merchandise volume (GMV) of Amazon's marketplace in 2025, by top domains (billion U.S. dollars)

Amazon third-party seller share 2007-2025
Share of paid units sold by third-party sellers on the Amazon platform from 2nd quarter 2007 to 4th quarter 2025

Amazon vendors receiving cost decrease requests in 2025, by type of goods
First-party vendors receiving cost price decrease requests from Amazon in 2025, by type of goods

Amazon's growth vs. category average in 2025, by segment
First-party vendors' sale growth on Amazon compared to the category average in 2025, by segment

eBay: quarterly net revenue 2014-2025
eBay's revenue from 3rd quarter 2014 to 3rd quarter 2025 (in billion U.S. dollars)

eBay: annual net revenue 2013-2024, by region
eBay's annual net revenue from 2013 to 2024, by region (in million U.S. dollars)

eBay: annual net income 2004-2024
Annual net income/loss of eBay from 2004 to 2024 (in million U.S. dollars)

eBay: gross merchandise volume 2007-2024
eBay's gross merchandise volume (GMV) from 2007 to 2024 (in billion U.S. dollars)
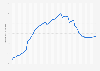
eBay: quarterly active buyers worldwide 2010-2025
Number of eBay's total active buyers from 1st quarter 2010 to 3rd quarter 2025 (in millions)

eBay: global marketing spend 2014-2024
Marketing expense of eBay worldwide from 2014 to 2024 (in billion U.S. dollars)

Monthly global downloads of Temu shopping app 2022-2025
Number of global downloads of shopping app Temu from September 2022 to October 2025 (in millions)

Countries with highest download share of Temu shopping app 2026
Download share of shopping app Temu as of January 2026, by country

Monthly number of visits to temu.com 2025
Number of monthly visits to temu.com from February to September 2025 (in millions)

Gross merchandise volume of Temu 2022-2026
Gross merchandise volume (GMV) of Temu from 2022 to 2024, with estimates until 2026 (in million U.S. dollars)

Monthly active users of Shein and Temu apps in the U.S. 2024-2025
Monthly active users (MAUs) of Shein and Temu mobile apps in the United States from May 2024 to May 2025, by week (in millions)

Etsy: annual revenue 2012-2024, by segment
Revenue of Etsy Inc. from 2012 to 2024, by segment (in million U.S. dollars)

Etsy: annual gross merchandise sales 2005-2024
Annual gross merchandise sales (GMS) of Etsy Inc. from 2005 to 2024 (in million U.S. dollars)

Etsy: number of active buyers 2012-2024
Number of active Etsy Inc. buyers from 2012 to 2024 (in millions)

Etsy: number of active sellers 2012-2024
Number of active Etsy Inc. sellers from 2012 to 2024 (in 1,000s)

Etsy buyer app downloads per month worldwide 2021-2025
Monthly downloads of the Etsy buyer app worldwide from January 2021 to March 2025 (in thousands)

Etsy: self-identification of sellers 2024
Self-identification and motivation of Etsy sellers as of 2024
Feel free to contact us anytime. We will respond to your inquiry as quickly as possible.


