
Xin Ou
Research expert covering Greater China
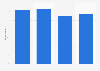
More than one in five consumer goods products in the United States is a private label. Over the past six years, private brands of U.S. consumer goods have witnessed a constant growth in market share, going from 18 percent in 2019 to close to 21 percent by 2024. These products, typically manufactured or supplied by third-party companies and sold under the brand name of the purchasing company, offer a cost-effective alternative to regional, national, or international brands as they incur lower marketing expenses. Particularly during times of economic hardship, such as the current inflationary period, shoppers have come to view private label goods as an affordable choice without compromising on quality, fueling their evident growth.
Their sales value has experienced a similar upward trend, rising from 176 billion to close to 272 billion U.S. dollars during the same period. However, unit sales have displayed some fluctuations without the same exponential growth. This trend is reflective of the overall retail market, where both store brands and name brands have been affected. Despite this, private labels have managed to gain a larger share of unit sales, at the expense of name brands. Factors such as lingering inflation, persistently high prices, an uncertain economy and job market, and a growing emphasis on waste reduction have collectively driven U.S. consumers to reduce their overall basket size.
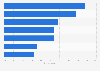
Private label products, encompassing both food and beverages and non-edible items, exhibited similar dynamics across the sector. However, the share of private labels varied significantly depending on the product category. In the food and beverages segment, for instance, private brands accounted for over 66 percent of refrigerated meat dollar sales, while only representing seven percent of salty snacks sales. Similarly, in non-edible categories, store brands held more than 86 percent of the dollar share for disposable tableware, but comprised approximately 12 percent of sales for dog food.
Shifting purchasing patterns have influenced consumers' perspectives on private label brands. A recent survey revealed that 78 percent of U.S. consumers are inclined to buy private label products due to their value, while 59 percent choose them based on trust in their perceived taste. Although national brands still enjoy greater popularity, preferences also differ based on the age of shoppers, with younger individuals exhibiting a stronger preference for store brands.
The convergence of changing consumer behavior, persistent price increases, and the growing occurrence of shrinkflation points towards a promising future for private labels.

Detailed statistics
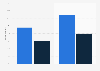
Share of CPG private labels sales in the U.S. 2025, by retailer
Detailed statistics
Private label product share in shopping baskets worldwide 2024

Detailed statistics
Private label unit share of consumer goods in the U.S. 2019-2024
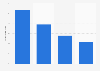
Global private label sales growth 2023-2024
Private label sales growth worldwide between Q1 2023 and Q3 2024
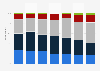
Global private label sales growth by region 2024
Private label sales growth worldwide between Q3 2023 and Q3 2024, by region
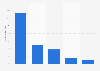
Private label product share in shopping baskets worldwide 2024
Share of private label products in shopping baskets in select countries worldwide in 2024
Share of CPG private labels sales in the U.S. 2025, by retailer
Share of consumer packaged goods (CPG) private label sales in the United States as of March 2025, by retailer

Private label dollar sales in the U.S. 2019-2024
Private label dollar sales of consumer packaged goods in the United States from 2019 to 2024 (in billion U.S. dollars)

Private label unit sales in the U.S. 2019-2024
Private label unit sales of consumer packaged goods in the United States from 2019 to 2024 (in billions)

Private label dollar share of consumer goods in the U.S. 2019-2024
Private label share of consumer goods sales value in the U.S. from 2019 to 2024
Private label unit share of consumer goods in the U.S. 2019-2024
Private label share of consumer goods sales volume in the U.S. from 2019 to 2024

Food and nonfood departments store brand dollar sales growth U.S. 2024
Private label food and nonfood departments dollar sales growth in the United States in 2024*

Dollar share of private labels in the U.S. 2024, by department
Dollar share of private labels in the United States in 2024, by product department

Unit share of private labels in the U.S. 2024, by department
Unit share of private labels in the United States in 2024, by product department

Edible private label product sales value in the U.S. 2024, by category
Sales value of the leading private label edible product categories in the United States in 2024 (in billion U.S. dollars)

Edible private label product dollar share in the U.S. 2024, by category
Private label dollar share of leading edible food and beverage categories in the United States in 2024

Non-edible private label product sales value in the U.S. 2024, by category
Sales value of the leading non edible product categories in the United States in 2024 (in billion U.S. dollars)

Non-edible private label product dollar share in the U.S. 2024, by category
Private label dollar share of leading non edible product categories in the United States in 2024

U.S. consumer attitudes to store brands as of 2025
Attitudes of consumers towards private label products compared to national brands in the United States as of 2025
Private labels and national brands increase in purchase in the United States 2025
Share of consumers who increased the frequency with which they purchase store brands and national brands in the United States as of April 2025

Shoppers' reasons for buying private labels in the U.S. 2025
Consumers' reasons for buying private brand items in the United States in 2025

U.S. consumers' store brand product spending change as of 2024, by income
Change in private label product spending behavior of consumers in the United States as of 2024, by income

CPG private label brands household penetration rate U.S. 2025
Leading consumer packaged goods (CPG) private label brands in the United States as of March 2025, by household penetration rate
Consumers trust in private labels in the U.S. by generation 2025
Share of consumers who trust store brands in the United States in 2025, by generation
Private labels first time buyers in the United States in 2024, by generation
Share of consumers who bought store brand products for the first time in the past three months in the United States as of December 2024, by generation
Feel free to contact us anytime. We will respond to your inquiry as quickly as possible.


